How to use Reach results to boost your school’s performance

Reach is a series of progress monitoring assessments that allow you to track your school’s performance year-on-year and figure out where you need to make improvements.
The assessments can help you and your teachers do the following (and more):
- Track performance year-on-year to measure progress
- Identify students’ knowledge gaps for each subject
- Identify high and low performing students, to teach inclusively
- Group and teach students by skill level
- Get concrete data to help teachers with report writing and parent teacher interviews
- Identify high-performing teachers who can help with professional development
- Discover which programs are working
- Assess writing skills year-by-year using a common scale
In this article, we provide an overview of how each of these work in Reach. Let’s get started.
1. Track performance year-on-year to measure progress
Progress is the name of the game in education, and Reach gives you comprehensive year-by-year performance data that shows how your students are advancing through their learning journeys.
Let’s say you want to know how each year level performed in their Mathematics test for 2023. You can see these results below:
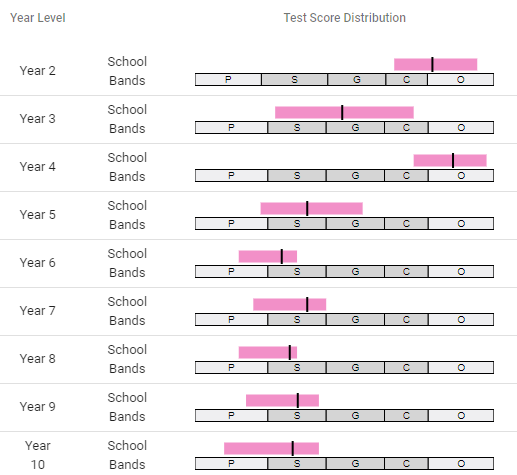
Bands: Participated, Satisfactory, Good effort, Commendable, Outstanding
Looking at the test score distribution, you can see that Year 2 and Year 4 both achieved “Outstanding” average results (the black lines) – a cause for celebration, and the possibility of your teachers challenging those students with more complex topics. But Year 6 is on the verge of the lowest “Participated” bracket. If things don’t change, could next year’s results be worse? You can validate this concern by looking at the cohort’s results over the last few years, to see how their performance is trending:
This data shows that they had a small improvement from Year 4 to Year 5, but then their average score dropped back to Year 4 levels in Year 6. We can see that there was a much smaller spread of scores (the pink bar) for Year 6, which is encouraging, but the lower average is worth investigating because you want to ensure the cohort is progressing quickly enough from year-to-year.
You can investigate more precisely with the Reach data. For example – are particular classes struggling more than others and bringing the averages down? You can answer this question by filtering the results by class.
After doing so, you discover that Class 6B’s performance for 2023 was much lower compared to the rest of their year:
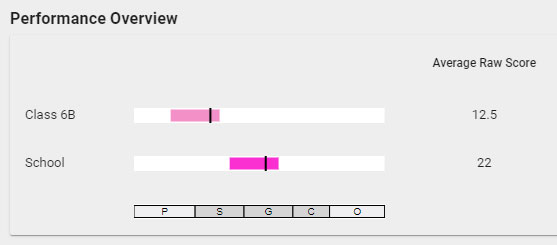
Bingo. You’ve identified a potential issue with that class, which might be validated more rigorously with other assessment data. If the problem is confirmed, you can approach the class’ teacher and discuss possible solutions. For example, they might want to delve into the performance of each sub-skill from the Reach assessment, giving them a broad idea of what needs to be worked on (more on this in the next section).
With this kind of year-on-year progress data, you can really see what’s happening with your school’s performance over time and figure out where the problems (and successes) lie. And this is just a single subject – you can do this comprehensively for every subject to identify high and low performing cohorts. It’s an excellent way to get a high-level view of each cohort’s performance for every subject, helping you identify emerging issues that require your attention.
Your Head of Years / teachers can delve into the progress data even more deeply. Let’s say they would like a snapshot of every Year 6 student’s progress over the last three years for Science, to identify which are moving forward quickly enough, which are stagnant, and which are falling behind. They can find this information in the “student development” report, which looks like this:
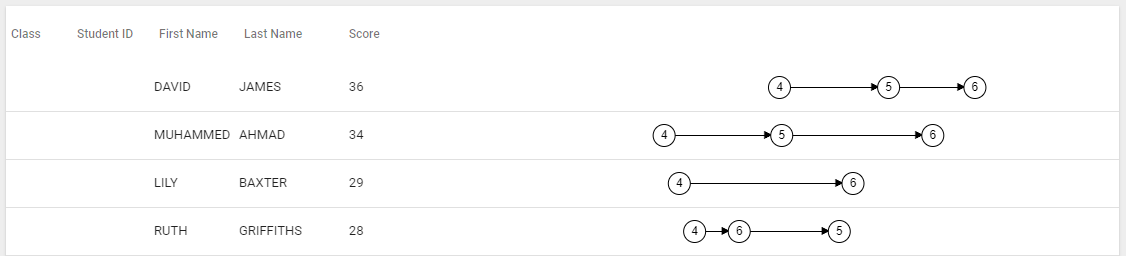
Here we can see that David is the most advanced of this group, achieving higher scores (their proximity to the right-hand side), and advancing at a steady pace from Year 4 to Year 6. Muhammed is similar, but because his line is longer, he’s made much faster progress from year-to-year. The biggest concern here is Ruth, who has not only progressed very slowly, but regressed in Year 6, getting a much lower mark than her Year 5 score. This tells us that Ruth may need an intervention. With access to every student’s results from year-to-year, your staff have the data they need to make informed decisions.
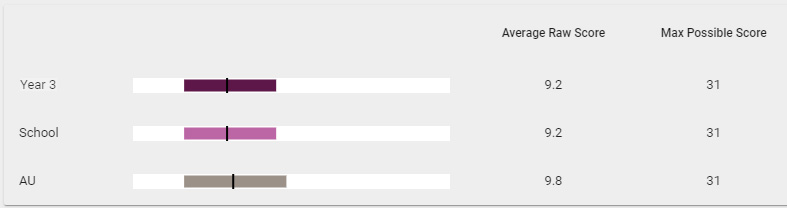
Finally, let’s go broad again for a moment. You’ve identified the year-on-year subject performance for a specific cohort, but what about a year in isolation? For example: how do your Year 3 students tend to perform for Digital Technologies?
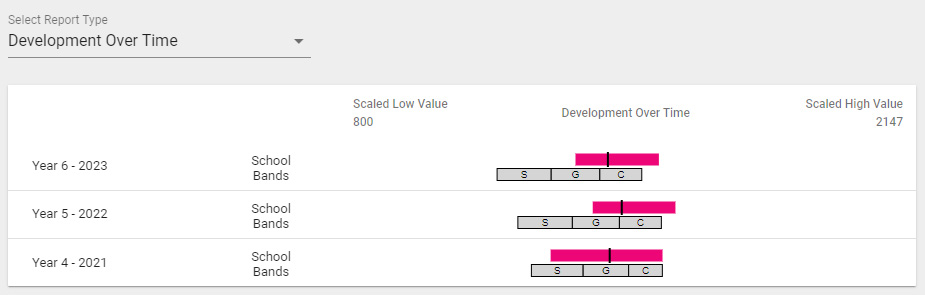
You can see this information in our “school comparison over time” report, shown below:
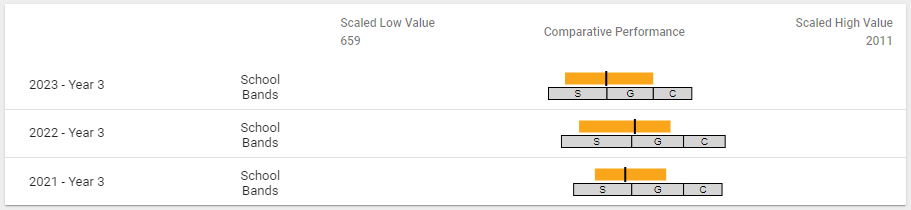
These results show that your Year 3 students in 2022 performed slightly better than those in 2021, but significantly worse than those in 2023. What happened here? Was there a major change that may have affected students’ learning for the subject? These kinds of issues are often worth investigating further in case they worsen.
2. Identify students’ knowledge gaps for each subject
Let’s continue with Class 6B’s poor Mathematics performance. You’ve flagged the issue with their teacher and asked them to look into it.
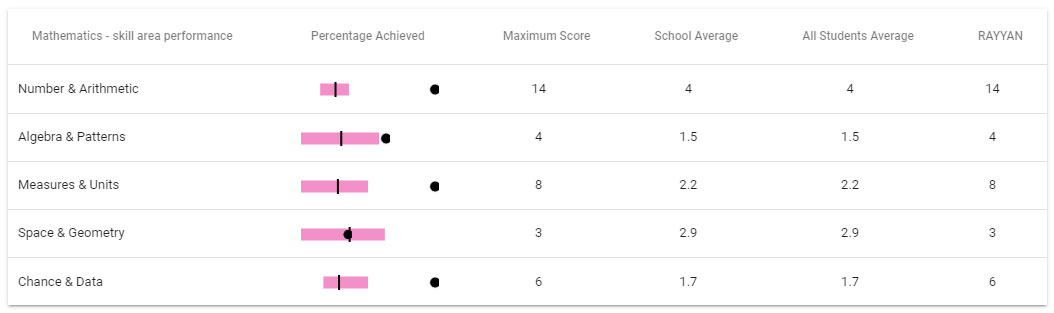
To start, they decide to analyse the cohort’s sub-skill performance for the subject, to get an idea of which specific skills are lacking. You can see this below:
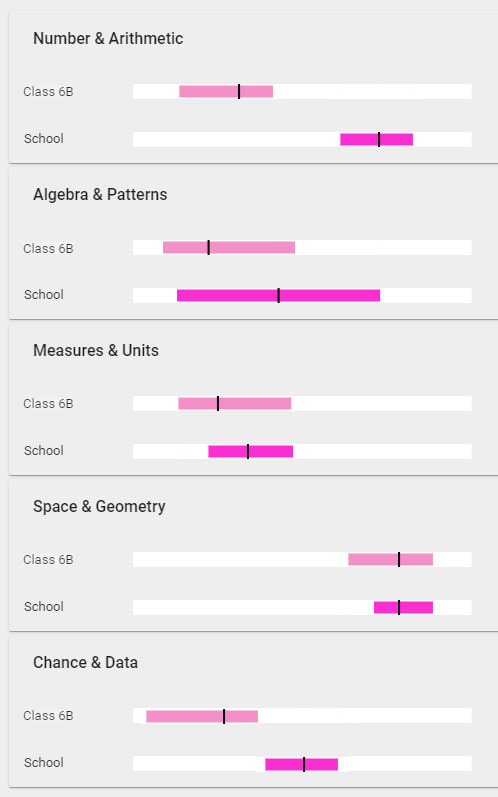
This shows that their average scores (the black line) are low across the board, except for Space & Geometry, where they performed slightly better than the rest of the school. So, the other four skill areas could do with some work. The consistently large pink bars also tell us that there is a wide spread of ability within each skill set, so the teacher will need to pitch their lessons at a greater variety.
Now your teacher has pinpointed the broad skill areas, they may want to identify the specific questions they should focus on within each of them. To do so, they can refine the results by question:
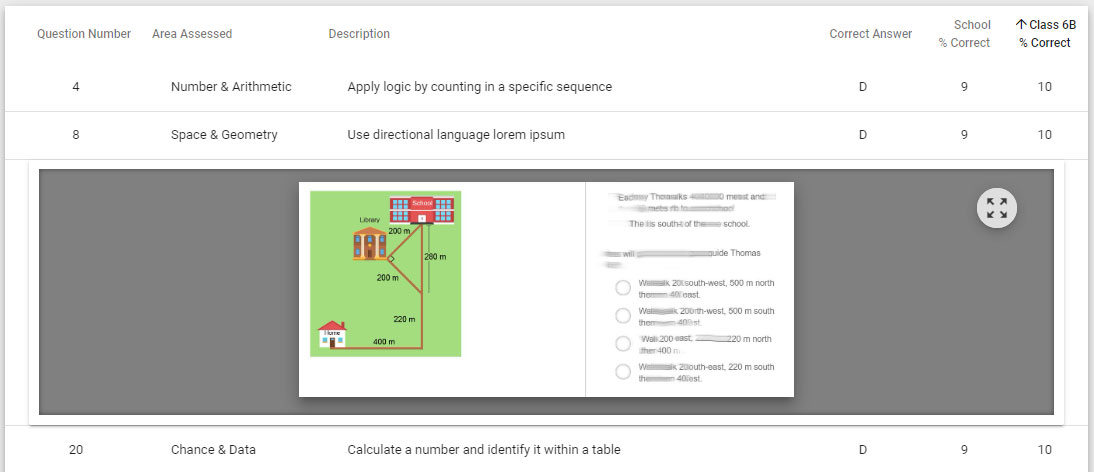
(To protect the integrity of our Reach tests, we’ve changed the descriptions for each question)
By sorting the data by lowest percentage correct for the class (the far-right column), the teacher can see which questions / topics their class found difficult compared to the rest of the school. They can then pick out those questions and work on them together in class.
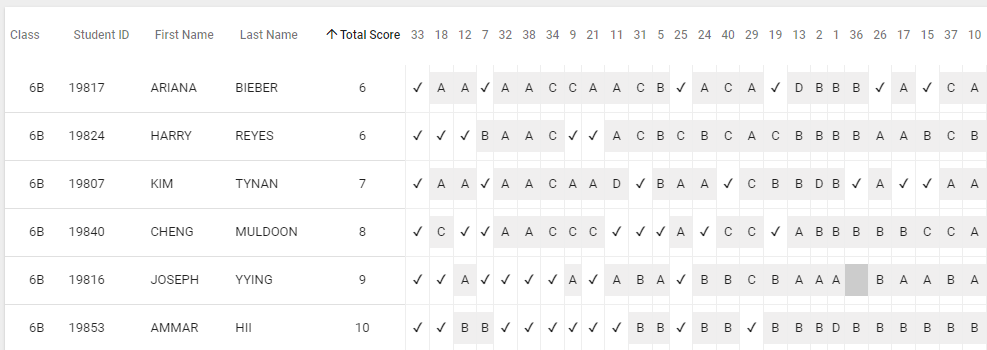
Here’s a different view of the same data (called “distractor analysis”), which shows your teacher what percentage of students answered the questions correctly (the white blocks), and which answered incorrectly (the grey blocks):
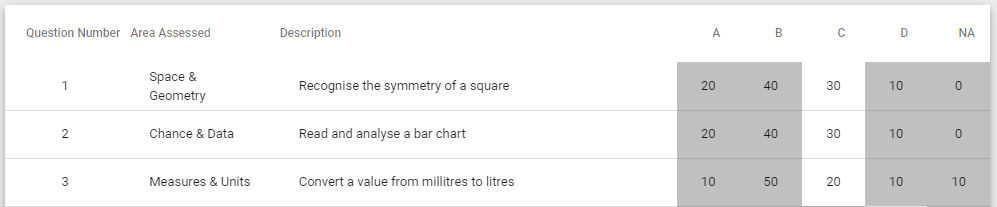
From this list, only 20% of students answered question 3 correctly, so it needs work. Your teacher can click the description, grab the question, and then work through it with students. And because these questions all roughly correlate to learning outcomes in the curriculum, your teacher can be confident that the appropriate content is being worked on/reported on, and that the improvements they make to their learning programs are worthwhile. This feature is a favourite with teachers because it tells them exactly what they need to work on with their students, making it an invaluable teaching tool.
3. Identify high and low performing students, to teach inclusively
So far we’ve covered performance for subjects, skill areas and specific questions, which help you and your teachers discover what needs to be worked on in class. But to truly provide each student with the support they need to succeed, your teacher must analyse their performances individually.
The students in Class 6B performed as follows for the Mathematics test, sorted from lowest to highest score:
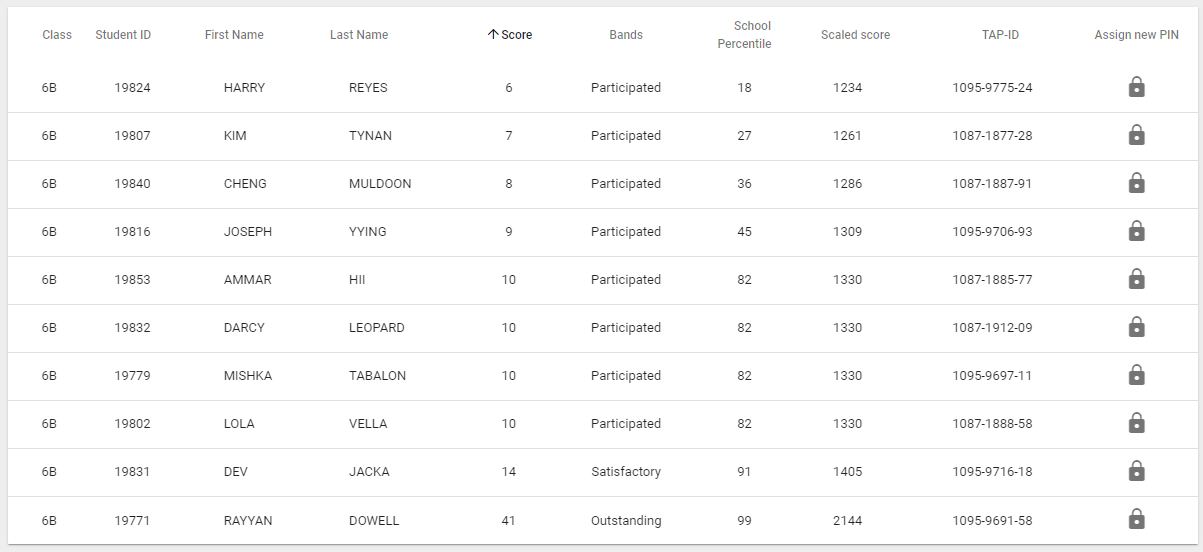
That’s a lot of low scores. Almost the entire class may need extra maths support.
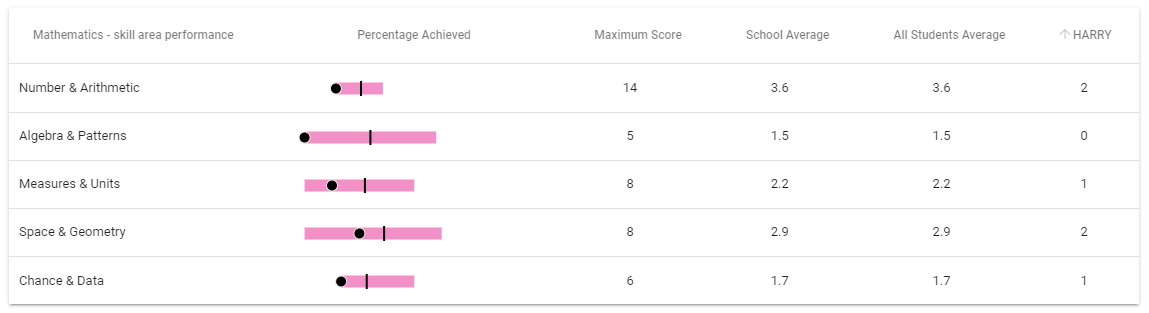
Your teacher can also click into each student and find out exactly how their skills compare to the rest of their class, as well as the rest of the school. Here’s how Harry Reyes did:
Or if your teacher would like a direct comparison to their classmates, they can use an alternative view:
And finally, they can sort the assessment by question difficulty to where Harry (or other students) dropped off as the test got harder. From the report below, we can see that he did well in the earlier questions, but went downhill from there:
This is incredibly powerful data because it helps your teachers pinpoint exactly who needs extra support, and for what specific subjects, skill areas and topics. Similarly, this data can help them locate the very best performers – those who may benefit from extra or advanced work to keep them engaged and learning at their optimal pace.
4. Group and teach students by skill level
With a clearer understanding of student performance for each subject, your teachers can decide whether to divide their classes into smaller ability-based groups, or form entirely new extra-curricular classes. The high performers can be given more complex and sophisticated content further down the curriculum (Ammar in the English example below), and the low performers may need some additional support on foundational content to gradually build their knowledge.
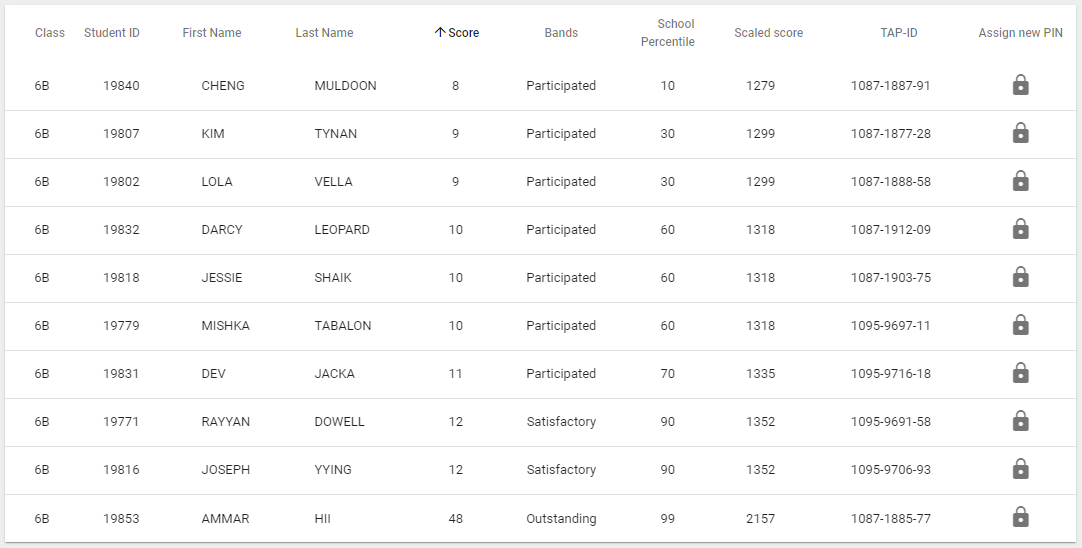
This grouping of students based on ability can happen within the same class, or they can form entirely new classes such as those found in Gifted & Talented programs.
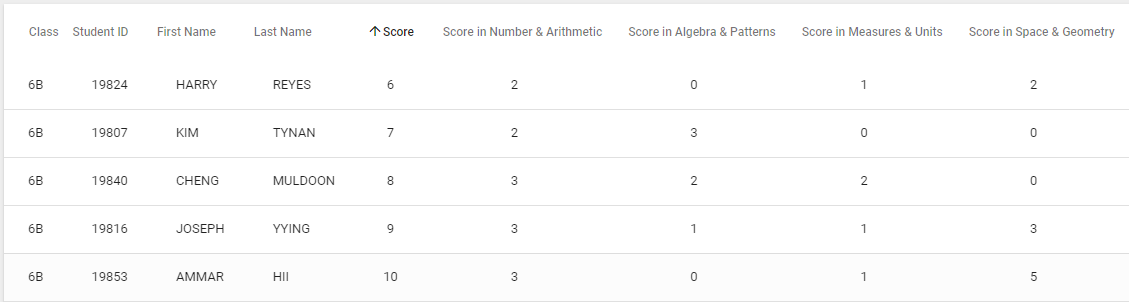
You can get more specific with your groups too. By analysing each students’ scores by skill area, you can figure out which of them need work on which specific skills, and then group them accordingly:
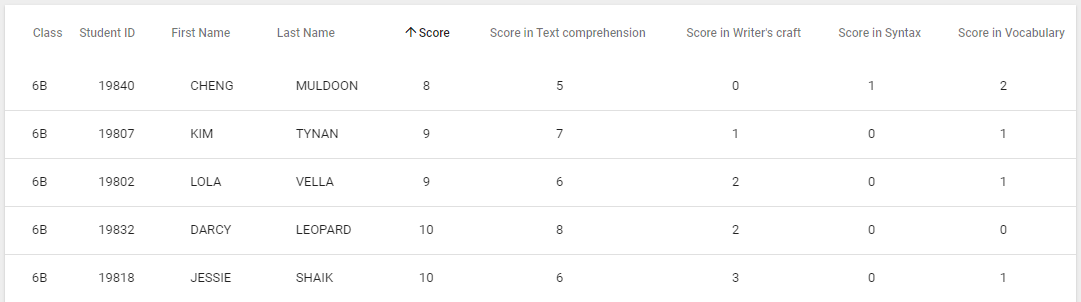
Whichever method you choose, Reach gives you the precise performance data you need to group students by skill level so that you can satisfy their unique learning needs.
5. Get concrete data to help teachers with report writing and parent teacher interviews
Objective assessment data helps your teachers write accurate reports for their students, clarifying their progress for both the school and their parents.
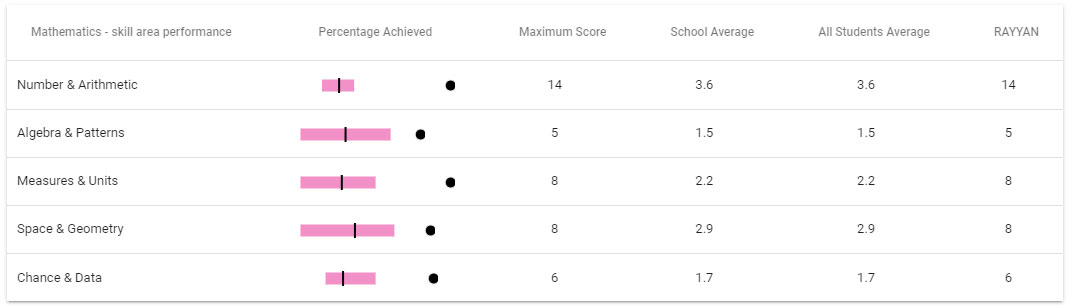
Let’s say you’re writing subject reports for Rayvan Dowell from Class 6B, and the first is Mathematics. With the Reach test, you can see his overall score for 2023 was Outstanding, with a score of 41:

… and he excelled at Number & Arithmetic and Measures & Units:
But was this an improvement on last year? Is he making progress (despite already doing very well)?
Here is how his overall Mathematics score looks for 2022 (he scored 35):
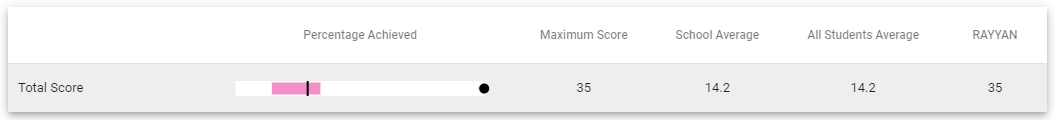
… and his performance for each skill area:
We can see that his overall score improved from one year to the next, with his Space & Geometry skills improving dramatically, and his Algebra & Patterns skills also showing clear progress. This insightful information can be shared in his report, showing exactly how Rayvan is progressing through his maths education.
When it’s time for the interview with Rayvan’s parents, your teacher can talk over his reports for every subject and help them understand where he is excelling, where he is on par, and where he might need some extra support. This kind of objective year-on-year assessment data is gold.
6. Identify high-performing teachers who can help with professional development
High-quality professional development keeps your teaching staff on top of their game, and one way of achieving this is by recruiting your very best teachers to educate the rest.
You likely already have a good idea of who your best teachers are, but you can substantiate your beliefs by checking out how their students perform in the annual Reach assessments. By analysing performance year-on-year for their classes, you can determine:
- Which teachers consistently achieve good performances across the board.
- Which teachers excel in certain subjects, like Science (Reach is the only progress monitoring assessment in Australia to offer Science).
- Which teachers need some extra support from yourself, or from their peers.
Once you’re certain of your highest performing teachers, you can ask if they’d be willing to assist with your PD program and help elevate their peers.
7. Discover which programs are working
The year-by-year assessment data in Reach is also useful validating programs you previously implemented.
Let’s say you recently created a Science program for your Year 5 students, to help improve their overall performance. Specifically, you identified issues surrounding Observing / Measuring skills, which the program focused on.
Here’s how your Year 5 students performed last year for the skill area:
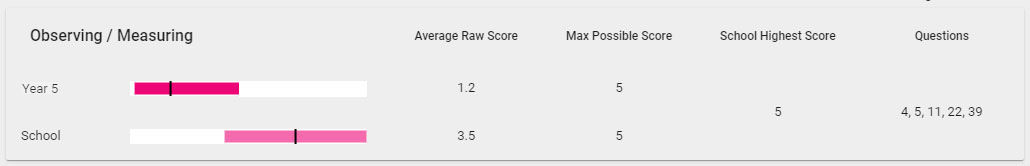
You can see that their performance was much lower, with an average spread of ability between students.
After completing the program throughout the year, here is how the students performed in the most recent test:
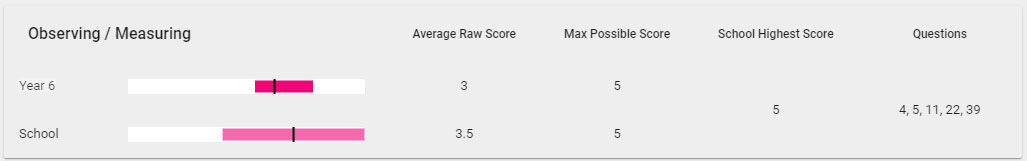
We can see a huge improvement in their performance, in addition to the spread of ability narrowing. And after analysing the other skill areas for the subject, you find that they either remained stable or also improved. The program worked!
This kind of analysis can be completed for every one of your learning programs and provides concrete evidence of their efficacy.
8. Assess writing skills year-by-year using a common scale
The Reach Writing assessment tests students’ skills by asking them to write an extended response to a task. It’s the same for every single year level, and is marked using the same criteria, which means it’s incredibly easy to track student progress from year to year.
Take a look at these Writing results for a group of Year 3 students:
Their scores are fairly low, but that’s what you’d expect from a group of Year 3 students who are still strengthening their writing abilities.
How do their results look in Year 4?
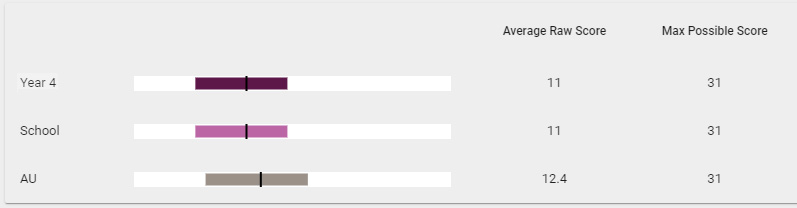
A small improvement – progress is being made!
And how about Year 5?
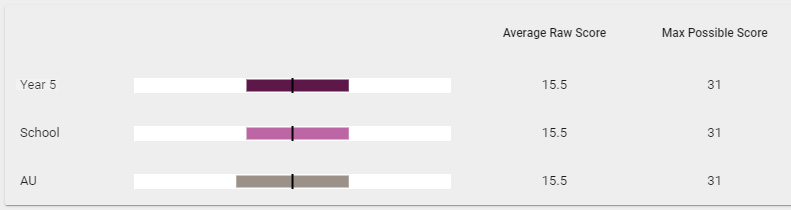
A big jump! This gives you confidence that your students’ writing abilities are improving year-on-year. If this wasn’t the case, your teacher could delve into the tested criteria, identify which of them were challenging for students, and then work on them in class.
Here’s how those criteria look for our Year 5 students, sorted by “students achieved”:
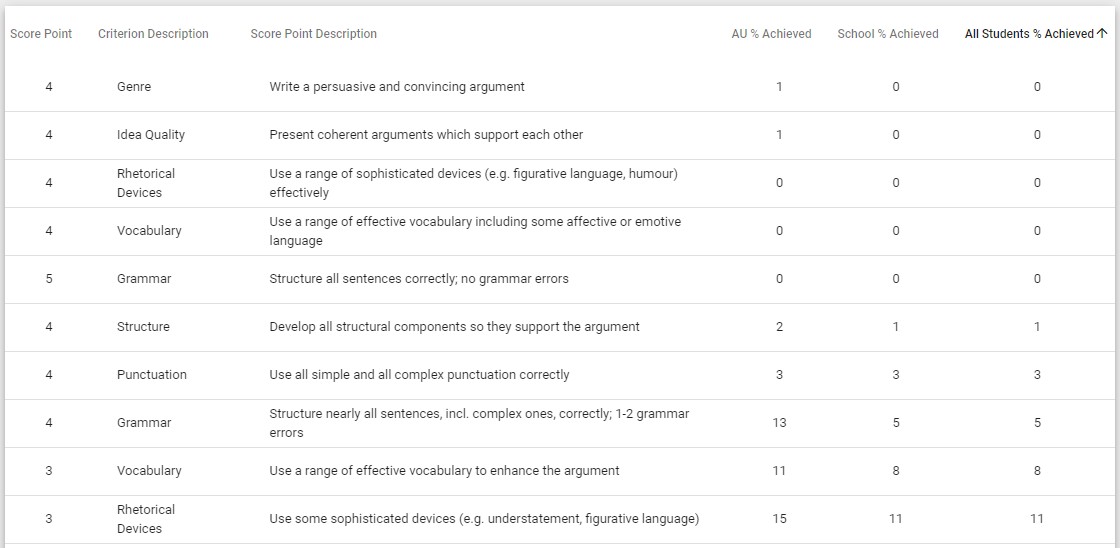
Your teacher can see what percentage of students succeeded for each task, its associated criteria (genre, idea quality, etc.), and how they fared against the rest of the school. A quick glance at this data tells them exactly what they need to work on with their students.
Ready to try Reach?
If you’d like to start reaping the benefits of Reach, you can learn more about it here, or contact one of our Assessment Consultants (including myself) for a chat. We’ll be happy to answer any questions you have.
 Written by Nardin Hanna
Nardin is a former primary school teacher of 10 years. During her time as a teacher, she served as Head of Years for K-2, was a trained NAPLAN marker, and was part of the team that wrote the 2021 NSW English Syllabus 3-6. She is currently an assessment consultant for ICAS and Reach.
Tag:Reach
You may also like

How science competitions build critical thinking