How does Reach grading work?

Reach assessments allow schools to accurately measure student progress year on year, and compare their performance to nationwide benchmarks.
If your school is using Reach for this purpose, or you’re considering using the assessments in future, you may be wondering how the grading system works. In this article, we’ll explain how Reach tests are scored, and how those scores translate into grades for students.
Reach grading and scoring
How Reach scores work
As with ICAS, Reach tests are composed of questions that have binary “correct” or “incorrect” answers. When the test is completed, the student’s final score is summed up and turned into a graded percentage (more below).
How Reach grading works
Unlike ICAS grading, which is based on comparative percentages, Reach grades are provided based on each students’ final “raw” score. That means they are not comparative, so the performance of others does not have any effect on each student’s final grade.
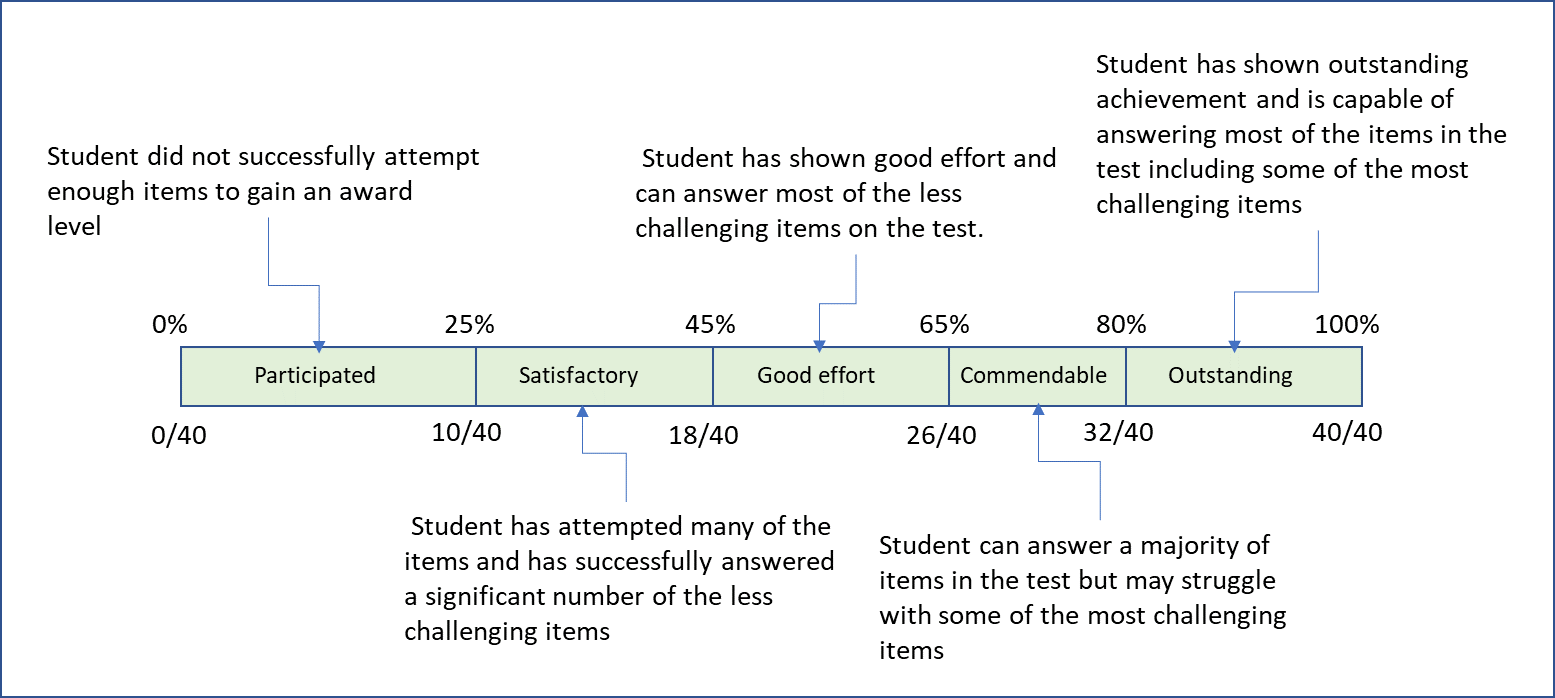
Reach grading is calculated using five achievement bands, based on these approximate percentages:
- 0 to <25% = participated
- ≥25% to <45% = satisfactory
- ≥45% to <65% = good effort
- ≥65% to <80% = commendable
- ≥80% to <100% = outstanding
You can see these bands laid out in the below graphic:

The boundaries between these bands vary for each year level and subject, but they are always derived from the percentage of questions answered correctly. 20 out of 40 questions answered correctly will always provide a 50% score/grade, unlike ICAS, where the grade changes depending on how others performed.
What do Reach results mean?
Reach results include a variety of pre-made reports that allow you to measure student performance, and their growth over time. So the meaning will change depending on the report you’re looking at.
For example, in the “Raw Score Results & Bands” report you can see the exact marks for every student for their Reach tests, as well as the bands (test score distribution) they fall under. By drilling into specific year levels you’ll find performance for specific sub-skills (like text comprehension for English), how students answered each question, performance for individual students, and much more. The reports are designed to give you the exact information you need to assess performance for your school, from year levels and cohorts to individual students.

Student performance by subject skill area
To learn more about what Reach results mean, check out our video here.


